To attract and invest in any business, an investor needs to carefully study the external and internal markets.
Based on the data received, draw up a project estimate, an investment plan, forecast revenue, generate a report on the movement Money. Most complete necessary information can be represented as a financial model.
Financial model of an investment project in Excel
Compiled for the predicted payback period.
Main components:
- description of the macroeconomic environment (inflation rates, interest on taxes and fees, required rate of return);
- projected sales volume;
- projected costs for attracting and training personnel, renting space, purchasing raw materials and materials, etc.;
- analysis of working capital, assets and fixed assets;
- sources of financing;
- risk analysis;
- forecast reports (payback, liquidity, solvency, financial stability, etc.).
In order for the project to be credible, all data must be confirmed. If an enterprise has several income items, then the forecast is made separately for each.
A financial model is a plan to reduce the risks of investing. Detail and realism are a must. When compiling a project in Microsoft Excel, the following rules are observed:
- initial data, calculations and results are on different sheets;
- the structure of calculations is logical and "transparent" (no hidden formulas, cells, cyclic references, a limited number of array names);
- columns correspond to each other;
- in one line - the same type of formulas.
Calculation of the economic efficiency of an investment project in Excel
To assess the effectiveness of investments, two groups of methods are used:
- statistical (PP, ARR);
- dynamic (NPV, IRR, PI, DPP).
Payback period:
The PP coefficient (payback period) shows the time period for which the initial investment in the project will pay off (when the invested money returns).
Economic formula for calculating the payback period:
where IC is the initial investment of the investor (all costs),
CF - cash flow, or net profit (for a certain period).
Calculation of the payback of an investment project in Excel:
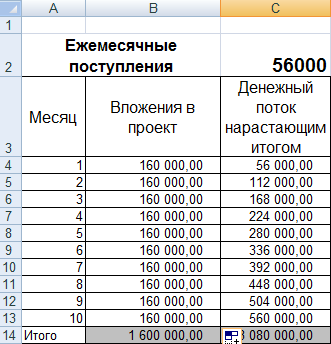
Since we have a discrete period, the payback period will be 3 months.
This formula allows you to quickly find the payback period of the project. But it is extremely difficult to use it, because. monthly cash receipts real life are rarely equal amounts. Moreover, inflation is not taken into account. Therefore, the indicator is used in conjunction with other performance evaluation criteria.
ROI
ARR, ROI - profitability ratios showing the profitability of the project without discounting.
Calculation formula:
where CFav. - average net profit for a certain period;
An investment project is a multi-page document containing descriptive and calculated parts.
The descriptive part provides a general description of the project, characteristics of the invested object, a description of the project idea and how to implement this idea, a description of the environment with a description of the market for competitive products, the advantages of own products, a marketing plan for conquering a market segment, and much more.
The calculation part contains technical calculations for the implementation of the project, the construction calculation part of the project with a construction estimate and the economic part with calculations of the economic efficiency of the proposed solution. We consider the calculation of the investment project from an economic point of view, the main thing in which is the calculation of the performance indicators of the investment project.
All indicators of investment efficiency can be divided into absolute indicators, measured in monetary units and time periods, and relative indicators, measured in percentages or ratios.
The first group of indicators includes:
- net present value of the investment project NPV (Net present value);
- payback period of investments PP (Pay-Back Period);
- discounted payback period DPP (Discounted payback period).
The second group consists of the following indicators:
- PI (Profitability Index);
- internal rate of return IRR (internal rate of return);
- modified internal rate of return MIRR (Modified Internal Rate of Return);
- investment efficiency ratio ARR (Accounting Rate of Return).
Calculation of the net present value of an investment project
This indicator is calculated by the formula:

- NPV - net present value of investments;
- ICo - initial invested capital (Invested Capital);
- CFt - cash flow (Cash Flow) from investments in the t-th year;
- r - discount rate;
- n is the duration of the project life cycle.
Calculation example: The company plans to replace obsolete equipment in the auxiliary equipment production workshop. This will require 85 million rubles for the purchase, delivery and installation of new equipment. The dismantling of old equipment is fully covered by its sale on the market. The lifetime of investments in new equipment is the time of its obsolescence, equal to 6 years. We accept the discount rate corresponding to the rate of return of the enterprise 14%. The calculation of income from the operation of new equipment by year is as follows:

The discount rate r in this example is unchanged. But this is unlikely, since it is influenced by many factors, such as inflation, changes in the refinancing rate, price fluctuations in the market for manufactured products, etc. In the above calculation formula, in such a case, the discount rate can be replaced by the forecast rate for each year. And when calculating the actual NPV for conducting an analysis of the effectiveness of investments, this is done in without fail.
Calculation of the payback period of investments

The payback period of investments is the rate of return on investment to the investor is measured in periods of time - months or years. The general form of the formula for its definition looks like this:
PP=N if ![]()
- CFt is the receipt of income from the project in the t-th year;
- N - payback period, years.
For the above example, PP=3 years, since 2 years and 8 months are more precise.
If cash flows are discounted at the accepted rate, then the discounted payback period of investments can be calculated using the formula:
DPP=N if,

More precisely, DPP = 3 years 6 months.
Calculation of relative performance indicators
Calculation of the yield index
The return on investment index shows the return on each invested investment unit at the current time, that is:

For our example, PI = (10.526 + 27.7 + 32.39 + 27.54 +25.26 + 17.51) / 85 = 140.926/85 = 1.66. This can be interpreted as follows: each ruble of investment brings 0.66 rubles of income.
Calculating the internal rate of return
The internal rate of return of investments is determined when the discounted cash inflows from the investments that caused them are equal to the investments. I.e:

IRR is the internal rate of return on investment.
Based on this formula, it becomes clear that IRR, on the one hand, is the average rate of return of the project for its entire life cycle, on the other hand, the marginal rate of return of the project, below which you cannot fall.
 Therefore, it is compared with barrier rates for a given invested object in order to make a decision on the feasibility of investment design. If it is equal to or less than the discount rate of cash flows, determined on the basis of the cost of the weighted average capital of the invested object, then any investor will refuse such a project without hesitation.
In our example, the discount rate is 14%. Let's see what is the value of the internal rate of return of investments in our example.
Let us determine the value of the internal rate of return by the method of successive approximation:

Thus, the IRR is 32%, which significantly exceeds the discount rate and the weighted average return on the invested object. The project is expedient to implement.
Quite often, in the process of investing in large projects, there are problems of lack of investment, in this case, a decision is made to reinvest the profits received during the implementation of the project. In this case, the modified internal rate of return on investment MIRR is calculated, which is calculated by the formula:
- d is the weighted average cost of capital;
- r - discount rate;
- CFt - cash inflows in the t-th year of the project life;
- ICt - investment cash flows in the t-th year of the project life;
- n is the life cycle of the project.
Here it is necessary to pay attention to the fact that all investments and reinvestments are given at the beginning of the project at the same discount rate, and all income is given at the end of the project at the discount rate of the corresponding weighted average cost of capital of the investee.
From the above equation, the modified internal rate of return in our example is determined:
As you can see, MIRR< IRR. The advantage of this indicator is that in the case of alternating inflows, it gives an objective assessment of the investment project, which cannot be given by the IRR indicator.
 The calculation of the effectiveness of the investment project, the example of which we have considered, should be supplemented by the calculation of one more indicator - the coefficient of efficiency of the investment project ARR. This indicator is the reciprocal of the payback period PP, that is, ARR = 1/PP, if we define the latter as the ratio of the average annual return on investment to the initial investment.
The formula for calculating the investment efficiency ratio in this case looks like this:

CFcr - average annual return on investment.
If the coefficient is calculated for the entire life cycle, then the formula takes the form:

If is the liquidation value of the investment project.
For our example, the calculation looks like this:
ARR = 228/ 6/ 85 = 0.447 or 44.7% in percentage terms.
Possible deviations from the calculation this indicator by the payback period is associated with the methodology for determining the average annual income from investments.
In conclusion, it should be noted that the calculation of all the above indicators is easy to carry out on a computer using standard Excel programs.
The total amount of necessary capital investments is 32 million euros (1126 million rubles) (see table 3). The planning horizon is 10 years (of which the total duration of the investment period; design, construction - 3.5 years), which takes into account the average life of similar enterprises before the next stage of reinvestment.
The following conditions were accepted in the calculations. Repayment conditions: flexible return based on monthly cash balances over 4.5 years (debt coverage ratio assumed equal to 1) starting from the 34th month of the project implementation (planning start - November 2013).
Table 3. Value of fixed assets
Note 2 - A scenario method was used to predict the implementation of the project, taking into account the effectiveness of the marketing campaign, the dynamics of changes in the competitive environment and the tourist flow (and, consequently, the indices of price changes for final products and the occupancy rate of accommodation facilities).
Stages of implementation of the first phase of the project:
- 1. Design stage - 3 months.
- 2. Preparatory stage - 3 months.
- 3. Stage of construction:
- a) 4-star hotel with 70 rooms - 30 months.
- b) clubhouse with golf courses - 36 months.
- 4. Effective service life - 180 months.
The financial performance of a project is often brought to the fore (they receive the most attention) when the project is presented to the investor. Indeed, they cannot be dispensed with, since the investor most often evaluates the project by a number of key indicators: IRR, NPV, PI (rate of return on investment costs), payback period, average accounting rate of return. At the same time, as a rule, he is not interested in the calculations themselves, but in the basic assumptions and the reliability of the initial information.
Here are the assumptions made in the calculations:
- 1. The taxation conditions taken into account when justifying the project comply with the legislation in force for the 4th quarter of 2013 Russian Federation and Krasnodar Territory: tax code RF, KZ No. 731 "On State Stimulation of Investment Activities in the Krasnodar Territory", Regulations "On the Expert Council for Investment Projects". On the basis of these norms, the following points were taken into account when forming the tax environment for the project:
- - the property tax rate is 2.2% per annum of the enterprise's property value;
- - the income tax rate is 20% (when determining the amount of income tax payable to the budget, the benefit associated with the reinvestment of profits was not taken into account; each period under study was attributed to the cost of production);
- - when forming turnovers on value added tax, the rate of the specified tax is taken equal to 18%;
- - VAT on permanent assets is set off in full at the time of commissioning of fixed assets and is subject to reimbursement at the expense of VAT on current activities payable to the budget;
- - depreciation is charged on a straight-line basis, taking into account the belonging of assets to different groups of fixed assets (the average useful life of all property is approximately 12 years);
- - in accordance with paragraph 1.1 of Art. 259 of the Tax Code of the Russian Federation, 10% of the cost of depreciable property is included in the expenses of the projected enterprise in the period of the start of operation of the main assets;
- - No other tax benefits are provided.
- 2. Among the factors that determine the trends in the formation of prices for the services of a new business center, the main ones are the following:
- - the cost of utility bills for organizations;
- - the cost of labor;
- - the cost of borrowed capital;
- - the cost of marketing activities;
- - the cost of products for the food and beverage service.
In the period from 2002 to the present, the cost utilities, the average size wages are growing at a rate that outpaces the general rate of inflation (by an average of 5-10%). In this regard, the cost estimates of all utility costs (for electricity, water supply, gas, sewerage) within 4 years from the start of the project were carried out at the rate of 15% of the price index, then - 8% of the index. The average increase in wages in the first 4 years of the project implementation was taken equal to 25%, then - 12%. The growth in the price of food products was taken in the range from 12% in the first year of the project to 8% during the commissioning and subsequent operation of the hotel (taking into account the increased increase in prices for locally produced products and a negative increase in expensive, finished products of foreign production, including the drinks).
- 3. The planning horizon is assumed to be 10 years, which is the average term for planning investments in commercial real estate. At the same time, the average period of capital reinvestment in real estate objects with characteristics similar to the project being implemented exceeds 10 years and is about 15 - 20 years. Therefore, the analysis took into account the liquidation income in the amount of 397 million rubles. at current prices for 41 planning periods (the period is 3 months), which in turn increased the net present value by 56 million for calculations with a discount rate of 20%, and by 121 million rubles. for a rate of 12%.
- 4. The forecast of the Central Bank refinancing rate is based on the official forecast of the Ministry of Economic Development and Trade for the level of inflation until 2015 (namely: inflation + 2%). Based on it, the overall budgetary efficiency (the amount of payments, taxes and fees paid to the budgets and non-budgetary funds of all levels) is 2523 million rubles. for an optimistic forecast and 1536 for a conservative one. The total budget efficiency, discounted to the start of the project, is 770 million and 472 million, respectively.
- 5. Current liabilities were determined taking into account the payment for most types of services of the projected enterprise at the time of the provision of these services. Settlements with suppliers of services and materials are carried out within a calendar month with a maximum deferred payment (at least 20 days).
- 6. Other forecast values of control parameters (for example, the interest rate included in the cost price) calculated for each planning period are given directly in the calculation tables of the feasibility study.
- 7. Discount rates are set: taking into account the average return on investment in real estate in the Krasnodar Territory as an alternative project implementation option (20%); average return on shares on the stock exchange (12%);
- 8. The interest rate on borrowed funds is 12%, deferment of payment of interest on the loan - 33 months;
- 9. Ruble inflation rate - at the level of the official long-term forecast of the Ministry of Economic Development and Trade;
- 10. Indices of wages, utilities and food products are growing at a pace that outpaces general inflation.
In our project, two scenarios were considered: optimistic and conservative, Table 4 and Figures 8 - 10.
The optimistic forecast implies a hotel occupancy of 67%, the sale of club memberships in 2.5 years, a period of reaching the planned capacity from 15% to 67% in 4 quarters, the number of employees is 164 people.
Table 4. Integral indicators of the project depending on the occurrence of various scenarios
|
Project indicators |
Optimistic scenario |
conservative scenario |
|
The main differences between the scenarios |
||
|
Starting marketing and PR budget for 2 years Sale Period 150 Club Memberships The period of reaching the planned capacity Number of employees |
|
|
|
Financial indicators |
||
|
Maximum rate on borrowed funds Simple Payback 2 Accounting rate of return Maximum loan debt 3 Debt service period |
|
|
|
NPV, at a discount rate of 20% Discounted payback period Return on investment costs |
|
|
|
Budget Efficiency |
||
|
Consolidated budget effect Federal budget and off-budget funds Regional budget |
|
|
Note 3 - This coefficient is calculated as the average annual occupancy of the hotel, cottages and, accordingly, restaurants; 2 - payback period from the date of commissioning of the hotel; 3 - the amount of debt, taking into account capitalized interest, the need for working capital.
Figure 8. Optimistic revenue and cost forecast for a golf club project

Figure 9. Optimistic debt servicing forecast for the project

Figure 10. Conservative Net Income Forecast for Total Investment Costs
In table 4, the conservative forecast assumes 44% occupancy (the current average for hotels in Krasnodar is 67%; over the past 5 years, the indicator has grown by an average of 1 - 2%), the sale of club memberships for 3 years, the period of reaching the planned capacity from 8% to 44% for 4 quarters, number of employees - 140 people, figures 8 - 10.
The pricing policy is similar to a 5-star hotel (from 10,000 to 35,000 rubles) and other private golf clubs in Russia.
The high integral stability of the project to individual parameters of the environment and the internal environment is determined by means of a variant analysis. At the same time, the conservative scenario of the project implementation was taken as the baseline option as the borderline option (the most negative one). The data obtained as a result of this analysis are reflected in table 5.
Table 5. Project sensitivity analysis (for a conservative forecast)
|
Factor indicator |
Change in factor indicator |
Dependent indicator |
Change in dependent indicator |
||
|
in kind |
in relative terms |
in kind |
in relative terms |
||
|
Room utilization rate |
13% increase |
Payback period, years |
10% reduction |
||
|
The price of products sold, (thousand rubles per night) |
10% increase |
Payback period, years |
10% reduction |
||
|
Operating costs, million rubles / month |
20% increase |
Payback period, years |
3% increase |
||
|
Room utilization rate |
100% increase Will not change |
Payback period, years |
7% increase |
||
|
Marketing budget for the first 2 years, million rubles Room utilization rate |
100% increase 5% increase |
Payback period, years |
3% increase |
||
|
Marketing budget for the first 2 years, million rubles Room utilization rate |
<...>
Other factors, ceteris paribus, for example, deviation from the initial value of the required investments, accelerated inflation for consumed resources, changes in the terms of settlements with counterparties, have practically no effect on the dynamics of cash flow, and hence on the investment indicators of the project as a whole.
In our case, there are three sides:
The parties signed an agreement of intent and created a limited liability company (51% - investor (Austria) and 49% - land owner (Russia)). Both participants undertake to invest in proportion to the shares and share the profits accordingly. The parties involved in the project decided that LLC "YUKK" will act first as a manager of the construction and current operation of the facilities, then - as an investor. Further work includes:
|
Liquidity ratios:
1. Current liquidity ratio, in %
It is calculated as the quotient of current assets divided by short-term liabilities and shows whether the company has enough funds that can be used to pay off short-term liabilities. According to international practice, the values of the liquidity ratio should be in the range from one to two (sometimes up to three). The lower limit is due to the fact that working capital must be at least enough to pay off short-term liabilities, otherwise the company will be at risk of bankruptcy. An excess of working capital over short-term liabilities by more than three times is also undesirable, since it may indicate an irrational asset structure. When calculating the indicator, the average values of variables for billing period.
2. Quick liquidity ratio, in %
The ratio of the most liquid part of current assets (cash, receivables, short-term financial investments) to short-term liabilities. From practice, its value should also be more than one. However, it is known from Russian sources that the optimal value of this coefficient in Russia is 0.7 - 0.8. When calculating the indicator, the average values of variables for the calculation period are used.
3. Net working capital, in monetary units
The difference between a company's current assets and its short-term liabilities. Net working capital is necessary to maintain the financial stability of the enterprise, since the excess of working capital over short-term liabilities means that the enterprise can not only pay off its short-term liabilities, but also has reserves for expanding activities. The optimal amount of net working capital depends on the characteristics of the company's activities, in particular on its scale, sales volumes, inventory turnover rate and receivables. The lack of working capital indicates the inability of the company to repay short-term liabilities in a timely manner. A significant excess of net working capital over the optimal need indicates the irrational use of enterprise resources. For example: issuing shares or obtaining loans in excess of real needs. When calculating the indicator, the average values of variables for the calculation period are used.
II. Business activity ratios:
Business activity ratios allow you to analyze how efficiently the company uses its funds.
1. Inventory turnover ratio, times
Reflects the rate at which stocks are sold. To calculate the coefficient in days, you need to divide 365 days by the value of the coefficient. In general, the higher the inventory turnover ratio, the less funds are tied up in this least liquid group of assets. It is especially important to increase turnover and reduce inventory in the presence of significant debt in the company's liabilities.
The calculation is made only for a period of one year, using the sum of direct production costs for this year and the average value of the sum of stocks for the current year. In the case of a calculation for a period of less than one year, the value of direct production costs should be multiplied by the coefficient, respectively: for one month - 12, quarter - 4, half a year -2. In this case, the average value of the amount of stocks for the billing period is used.
2. Accounts receivable turnover ratio, days.
Shows the average number of days it takes to collect a debt. The smaller this number, the faster the receivables are converted into cash, and therefore the liquidity of the working capital of the enterprise increases. A high value of the coefficient may indicate difficulties in collecting funds from accounts receivable.
The calculation is made only for a period of one year, while using the total revenue for the year and the average value of accounts receivable for the current year. If the calculation is carried out for a period of less than one year, the value of proceeds from the sale of products (services) must be multiplied by the coefficient, respectively: for one month - 12, for a quarter - 4, for half a year -2. In this case, the average value of receivables for the billing period is used.
3. Turnover ratio accounts payable, days
This is the average number of days it takes a company to pay its bills. The fewer days, the more internal funds are used to finance the company's working capital needs. Conversely, the more days, the more accounts payable are used to finance the business. It is best when these two extremes are combined. Ideally, an enterprise It is advisable to collect debt on accounts receivable before you need to pay debts to creditors. A large number of days may indicate insufficient funds to meet current needs due to reduced sales, increased costs, or increased working capital requirements.
The calculation is made only for a period of one year, using the total amount for which purchases were made (direct production costs: the cost of raw materials, materials and components, excluding piecework wages for the current year and the average value of accounts payable for the current year. If the calculation is carried out for a period of less than one year, the value of the purchase amount must be multiplied by a coefficient, respectively: for one month - 12, for a quarter - 4, for half a year - 2. In this case, the average value of accounts payable for the billing period is used.
4. Working capital turnover ratio, times
Shows how effectively the company uses investments in working capital and how this affects sales growth. The higher the value of this ratio, the more efficiently the company uses net working capital.
the calculation is made only for a period of one year, using the total proceeds from the sale of products or services for the current year and the average value of net working capital (see I, 3) for the current year. In the case of calculation for a period of less than one year, the amount of revenue should also be multiplied by the appropriate coefficient, and the value of net working capital should be the average for the calculation period.
5. Turnover ratio of fixed assets, times
Capital productivity. This coefficient characterizes the effectiveness of the use of fixed assets by the enterprise. The higher the value of the coefficient, the more efficiently the company uses fixed assets. A low rate of return on capital indicates insufficient sales or too high a level of capital investment. However, the values of this coefficient differ greatly from each other in different industries. Also, the value of this ratio strongly depends on the methods of calculating depreciation and the practice of assessing the value of assets. Thus, a situation may arise that the fixed asset turnover rate will be higher in an enterprise that has worn-out fixed assets.
The calculation is made only for a period of one year, using the total proceeds from the sale of products (services) for the current year and the average value of the amount of non-current assets for the current year. In the case of calculating the coefficient for the periods: month, quarter, half year, the average value of the amount of non-current assets for the billing period is involved in the calculation, and the value of the proceeds received for reporting period must be multiplied by 12, 4 and 2 respectively.
6. Asset turnover ratio, times
It characterizes the effectiveness of the company's use of all available resources, regardless of the sources of their attraction. This coefficient shows how many times a year a full cycle of production and circulation is completed, bringing the corresponding effect in the form of profit. This ratio also varies greatly by industry.
The calculation is made only for a period of one year, using the total proceeds from the sale of products (services) for the current year and the average value of the amount of non-current assets for the current year. In the case of calculating the coefficient for the periods: month, quarter, half year, the average value of the sum of all assets for the billing period is involved in the calculation, and the value of the revenue received for the reporting period should be multiplied by 12, 4 and 2, respectively.
III. Capital structure indicators (solvency ratios):
The solvency of an enterprise is, first of all, the ability of an enterprise to meet long-term obligations, without liquidating long-term assets. Paying companies are usually the best protected against bankruptcy. The following relationships are used to assess solvency.
1. Amount of liabilities to assets, in %
Shows how much of the assets are financed by debt, regardless of the source. The calculation process uses the average values of variables for the calculation period.
2. Long-term liabilities to assets, in %
Shows what share of the company's assets is financed by long-term loans. The calculation process uses the average values of variables for the calculation period.
3. Long-term liabilities to non-current assets, in %
Demonstrates: what proportion of fixed assets is financed by long-term loans. The calculation process uses the average values of variables for the calculation period.
4. Financial independence ratio, in %
It characterizes the dependence of the firm on external loans. The higher the value of the coefficient, the more loans the company has, the higher the risk of insolvency. A high value of the coefficient also reflects the potential risk of the enterprise having a shortage of funds. The interpretation of this indicator depends on many factors: the average level of this ratio in other industries, the company's access to additional debt sources of financing. The calculation process uses the average values of variables for the calculation period.
5. Interest coverage ratio or creditor protection ratio, times
It characterizes the degree of protection of creditors from non-payment of interest on the granted loan and demonstrates: how many times during the reporting period the company earned funds to pay interest on loans. This indicator also allows you to determine the acceptable level of reduction in profits used for interest payments. The calculation is made for different periods of time, while using the total values for the period
IV. Profitability ratios:
The profitability ratios show how profitable the company's activities are.
1. Profitability ratio of gross profit, in %
Shows the share of gross profit in the sales volume of the enterprise. The calculation is made for different periods of time, while using the total values for the period
2. Profitability ratio of operating profit, in %
Shows the share of operating profit in sales volume. The calculation is made for different periods of time, while using the total values for the period. Profitability ratios of net profit, in%. Shows the share of net profit in sales volume.
The calculation is made for different periods of time, while using the total values for the period
3. Return on current assets, in %
Demonstrates the ability of the enterprise to ensure a sufficient amount of profit in relation to the working capital used by the company. The higher the value of this ratio, the more efficiently working capital is used.
The calculation is made for a period of one year using the average value of current assets. To calculate for a period of less than one year, the value of profit is multiplied by the appropriate coefficient (12, 4, 2) and the average value of current assets for the period is used.
4. Profitability of non-current assets, in %
Demonstrates the ability of the enterprise to provide a sufficient amount of profit in relation to the fixed assets of the company. The higher the value of this ratio, the more efficiently fixed assets are used.
The calculation is made for a period of one year using the average value of non-current assets. To calculate for a period of less than one year, the value of profit is multiplied by the appropriate coefficient (12, 4, 2) and the average value of non-current assets for the period is used.
5. Return on assets (ROI), in %
Shows how many monetary units it took the company to receive one monetary unit of profit. This figure is one of the most important indicators competitiveness.
The calculation is made for a period of one year using the average value of total assets. To calculate for a period of less than one year, the value of profit is multiplied by the appropriate coefficient (12, 4, 2) and the average value of total assets for the period is used.
6. Return on equity, in %
Allows you to determine the effectiveness of the use of capital invested by the owners of the enterprise. Usually this figure is compared with a possible alternative investment in other securities. The return on equity shows how many monetary units of net profit each unit invested by the owners of the company earned.
The calculation is made for a period of one year using the average value of own (share) capital. To calculate for a period of less than one year, the value of profit is multiplied by the appropriate coefficient (12, 4, 2) and the average value of equity for the period is used.
V. Investment ratios:
Indicators characterizing the value and profitability of the company's shares.
1. Earnings per share, in monetary units
Shows what share of net profit falls on one ordinary share in circulation. Shares outstanding are defined as the difference between the total number of ordinary shares in issue and the treasury shares in the portfolio. If the company's capital structure contains preferred shares, the amount of dividends paid on preferred shares must be deducted from net profit. It should be noted that this indicator is one of the most important indicators affecting the market value of the company's shares. This indicator is calculated only for a period of one year.
2. Dividends per share, in monetary units
Shows the amount of dividends distributed to each ordinary share. This indicator is calculated only for a period of one year.
3. Dividend coverage ratio, times
Demonstrates the ability of the company to pay dividends from profits. Shows how many times dividends can be paid out of the company's net profit. This indicator is calculated only for a period of one year.
4. Amount of assets per share, in monetary units
Shows what proportion of the company's assets is owned by the holder of one ordinary share. This indicator is calculated only for a period of one year.
5. Ratio of share price and profit, times
This ratio shows how many monetary units shareholders are willing to pay for one monetary unit net profit of the company. The value of the market value of an ordinary share is calculated automatically or entered by the user.
To calculate the effectiveness, it is necessary to consider the calculated indicators.
discount step. All calculations of performance indicators are carried out with a step equal to one month. The monthly discount rate is obtained from the annual discount rate using the following formula:
The payback period is the time required to cover the initial investment from the net cash flow generated by the investment project. The calculation of the indicator is carried out according to the formula:
![]() ,
,
PB - payback period.
In order for the project to be accepted, it is necessary that the payback period be less than the duration of the project.
The discounted payback period is calculated similarly to the simple payback period, however, when summing the net cash flow, it is discounted. Calculation of the indicator:
![]() ,
,
where Investments - initial investment,
CFt - net cash flow of month t,
DPB - discounted payback period.
The average rate of return represents the profitability of the project as the ratio between the average annual income from its implementation and the value of the initial investment. Calculation of the indicator:
![]() ,
,
where Investments - initial investment,
CFt - net cash flow of month t,
N - duration of the project (in years),
Net present income. Calculation of the indicator:
![]() ,
,
where Investments - initial investment,
CFt - net cash flow of month t,
r - monthly discount rate.
The calculation of the profitability index is carried out according to the formula:
 ,
,
where Investments - initial investment,
CFt - net cash flow of month t,
r - monthly discount rate,
The internal rate of return is calculated by the formula:
![]() ,
,
where Investments - initial investment,
CFt - net cash flow of month t,
IRR - internal rate of return.
The project is considered acceptable if the calculated IRR value is not lower than the required rate of return. The value of the required rate of return is determined by the investment policy of the company.
The future value of the project (Terminal value) - the value of the proceeds received from the implementation of the project, referred to the end of the project using the rate of return on reinvestment. The rate of return on reinvestment, in this case, means the income that can be received by reinvesting the proceeds from the project.
![]() ,
,
where R is the rate of return on reinvestment (monthly),
CFt is the net cash flow of month t.
The modified internal rate of return is defined as the discount rate at which the following condition is met:
![]() ,
,
where COt - payments of month t,
r - required rate of return on investment (monthly),
N - duration of the project (in months),
MIRR - modified internal rate of return (monthly).
That is, to calculate the indicator, project-related payments are discounted at the start of the project using a discount rate based on the cost of capital raised (funding rate or required rate of return on investment), and project revenues are discounted at the end of the project using a discount rate based on on possible income from the reinvestment of these funds (the rate of return on reinvestment). After that, the modified internal rate of return is determined as the discount rate that equalizes these two values (adjusted payments and receipts).
Duration is an indicator that characterizes the amount of net cash flow generated by the project. It can be interpreted as the average period of time until the project starts to make a profit. The indicator is calculated by the formula:
 ,
,
where CFt is the net cash flow of month t,
r - monthly discount rate,
PV - the total cash flow of the project, calculated by the formula:
![]()
For the most accurate assessment of the effectiveness of the project being developed, a number of financial indicators are calculated and analyzed. Let's list some.
The internal rate of return is a discount rate that equates the amount of reduced income from an investment project to the amount of investment, i.e. investments pay off, but do not bring profit. The value of this rate is completely determined by the "internal" conditions that characterize the investment project. The calculated value is compared with the required rate of return on invested capital. If it is equal to or more than the rate of return on capital required by the investor, then the investment is economically justified; if it is less, the investment in the project or program under consideration is inexpedient.
Net present value (NPV) is the discounted present value of the future cash flows of an investment project, less the investment. Used to evaluate projects requiring capital investment. With a positive value of NPV, it is considered that this capital investment is effective.
The payback period of an investment is the period of time during which the net income from capital investments becomes equal to the value of investments, is defined as the expected number of years during which the original investment will be recovered. This criterion ignores cash flows beyond the payback period and also does not take into account the time value of money. The indicator is easy to calculate. The payback period allows you to divide projects into long-term and short-term and thus gives some idea of the degree of risk, but does not allow you to judge the profitability of the investment.
The discounted payback period - a modification of the criterion "Payback period of investment" - is determined according to the same algorithm, but based on the cash flow discounted at the price of the capital of this project. The indicator is free from ignoring the fact of unequal cash flows arising at different points in time.
The profitability index is a criterion for evaluating an investment project, defined as the quotient of dividing the present value of the future cash flows associated with its implementation by the present value of the initial investment (income per unit cost). If the index is greater than one, then the project can be accepted. Projects are arranged in descending order of the index, i.e. in descending order of attractiveness.
The break-even point is the minimum allowable (critical) level of production and sales at which the project remains break-even, that is, it does not bring any profit or loss. The lower this level is, the more likely it is that the project will be viable in an unpredictably shrinking market. The indicator characterizes the risk of an investment project, but ignores tax payments, is used when comparing projects "within" the same enterprise.
Operating leverage is a quantitative assessment of the change in profit depending on the change in sales volumes. Operating leverage - the ratio of the contribution to cover fixed costs to the amount of profit; a progressive increase in net profit with an increase in sales, due to the presence of fixed costs that do not change with an increase in production and sales. If the share of fixed costs is large, then with a decrease in sales income, the value of net profit will significantly decrease. Ceteris paribus, the higher the operating leverage (the greater the fixed costs in total costs), the higher the commercial risk.
The financial autonomy ratio shows the share of assets that are provided with own funds, and is defined as the ratio of own funds to total assets. The lower the value of the coefficient, the more loans the company has, the higher the risk of insolvency, potential cash deficit for the company. If the coefficient is equal to 1, the activity of the firm is financed entirely by its own funds.
The coefficient of financial dependence characterizes the dependence on external loans. It is calculated as the ratio of borrowed funds to total assets. The higher the value of the coefficient, the more loans the company has, the higher the risk of insolvency, potential cash deficit for the company.
Coefficient financial risk- the ratio of borrowed capital to equity capital. The lower the financial risk ratio, closer to "0", the more financially stable the enterprise.
The financial stability ratio characterizes the share in the capital of the enterprise attributable to the company's own capital and its long-term debt. It is calculated as the ratio of equity to borrowed capital. The higher this indicator, the more stable the enterprise.